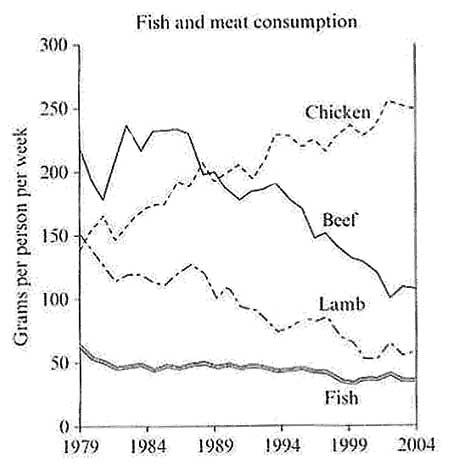
The graph above shows the consumption of fish and some different kinds of mear in a European country between 1979 and 2004.
Summarise the information by selecting and reporting the main features, and make comparisons where relevant.
The graph shows change in consumption of chicken, beef, lamb and fish in a particular European country between years 1979 and 2004. It is clear that over the period of 25 years , the consumption of chicken soared , while others experienced a downfall.
In 1979, the amount of beef consumed per person per week was around 220 grams which fell dramatically to just above 100 grams. A similar trend was noted in lamb consumption which stood at 150 grams in 1979 and was down to approximately 50 grams by year 2004. The consumption of fish was rather more stable as compared to beef and lamb though it's consumption also decreased. Starting with 53 grams of consumption of fish in year 1979 it decreased to just 47 grams.
In contrast, chicken displayed an upward trend ; the consumption of chicken starting for 140 grams per week per person in year 1979 soared to 250 grams by year 2004.
In conclusion, over the 25 years period , the consumption of chicken increased dramatically while popularity of other fish and meat decreased.
(176 words)
This is very fine piece of work i think so it is good to get a high score in writing module . Thanks you
ReplyDeleteSome teachers says we should write overview in a particular paragraph.will I get high score to write such way?
ReplyDelete